SAN DIEGO, Calif., May 3, 2023 (SEND2PRESS NEWSWIRE) — Mortgage Capital Trading, Inc. (MCT®), the leader in capital markets software and services supporting more lenders with hedging and pipeline management solutions than any other single provider, is pleased to present the MCTlive! Lock Volume Indices for April 2023. MCT Data represents a balanced cross section of several hundred lenders among retail, correspondent, wholesale, and consumer direct channels. A broad-based view of the entire market provides a more accurate picture of mortgage originations versus indices that are influenced by mega lenders. The April MCTlive! Lock Volume Indices is broken out by transaction type: purchase, rate/term refinance, and cash out refinance.
April MCTlive! Lock Volume Indices shows that after an upward trend in March, lock volume decreased slightly across the board for the month. Purchase lock activity was down 3% compared to March, rate/term refinance volume was down 2%, and cash-out refinance volume was down 3.6%. Lock activity in total was down 3% versus March. While there was a slight downturn in April, we should see lock activity begin to trend upward as the Fed reaches the terminal Fed funds rate and we begin to move into the Spring. As it stands, total lock activity is still down 29.75% from a year ago. That is primarily due to a drop off in refinance demand, as purchase lock activity sits 24.6% lower than at the same point last year. Rate and term refinance volume is down 56.87% from one year ago, and cash-out refinance volume is down 65% over that same period.
It is important to note that MCT’s rate lock activity indices are based on actual dollar volume of locked loans, not number of applications. Especially in a tight purchase market, MCT believes its methodology (using actual loans locked vs. applications) is a more reliable metric. There is a higher likelihood of having multiple applications per funded loan, and prequals do not convert at as high of a rate in the current market as has historically been the case – especially when applications are counted at the early stage of entering a property address.
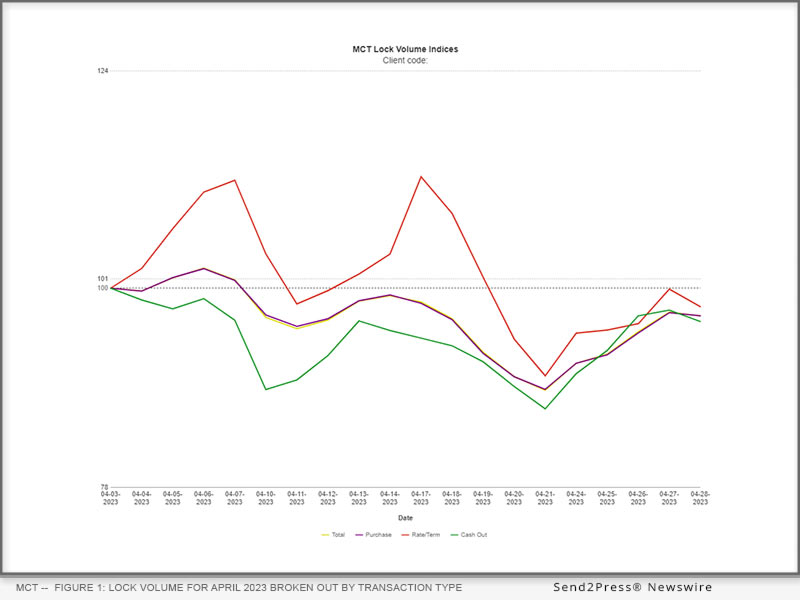
Figure 1: Lock volume for April 2023 broken out by transaction type.
FIGURE 2: INDEX VALUES TO END APRIL AS A PERCENTAGE BENCHMARKED TO THE START OF THE MONTH
Category | Month-Over-Month Index Value Change
Total -3.07%
Purchase -3.04%
Rate/Term Refinance -2.04%
Cash Out Refinance -3.69%
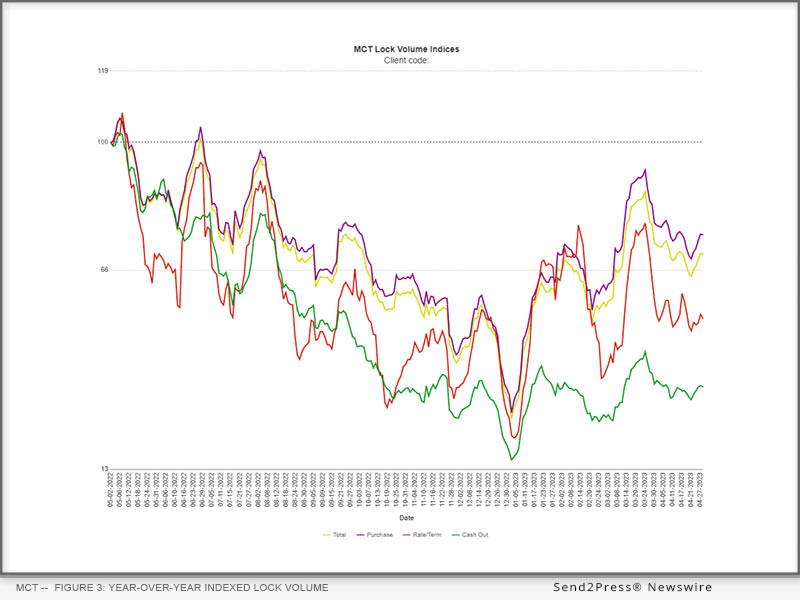
Figure 3: Year-over-year indexed lock volume.
FIGURE 4: INDEX VALUE CHANGE YEAR-OVER-YEAR
Category | Year-Over-Year Index Value Change
Total -29.75%
Purchase -24.60%
Rate/Term Refinance -56.87%
Cash Out Refinance -65.07%
MCT will be publishing the MCTlive! Mortgage Lock Volume Indices monthly, intending the data to serve as an enduring informational tool for industry participants, analysts, and watchers.
About MCT:
Founded in 2001, Mortgage Capital Trading, Inc. (MCT) ® has grown from a boutique mortgage pipeline hedging firm into the industry’s leading provider of fully integrated capital markets services and technology. MCT’s offerings include mortgage pipeline hedging, best execution loan sales, business intelligence and analytics, outsourced lock desk solutions, MSR valuation, hedging, and bulk sales, and the world’s first, truly open marketplace for loan sales.
MCT supports independent mortgage bankers, depositories, credit unions, warehouse lenders, and correspondent investors of all sizes within its award-winning digital platform, MCTlive! ®. Headquartered in sunny San Diego, MCT also has offices in Healdsburg, CA, Philadelphia, PA and Texas.
For more information, visit https://mct-trading.com/.
MEDIA ONLY CONTACT:
Ian Miller
Chief Marketing Officer
Mortgage Capital Trading
pr@mctrade.net
News Source: Mortgage Capital Trading Inc.