PLANO, Texas, Jan. 13, 2026 (SEND2PRESS NEWSWIRE) — Optimal Blue today released its December 2025 Market Advantage mortgage data report, showing that mortgage rate-lock activity ended the year on a firm footing, bucking typical holiday-driven seasonality. Total lock volume rose 2% month over month (MoM) from November and finished 30% higher year over year (YoY), driven primarily by rate-and-term refinances, which climbed 13% from November and more than 170% compared with December 2024. Cash-out refinance volume rose a modest 1% MoM but remained up a strong 35% YoY. Purchase activity dipped just 1% from November despite holiday headwinds to end December up 7% YoY.
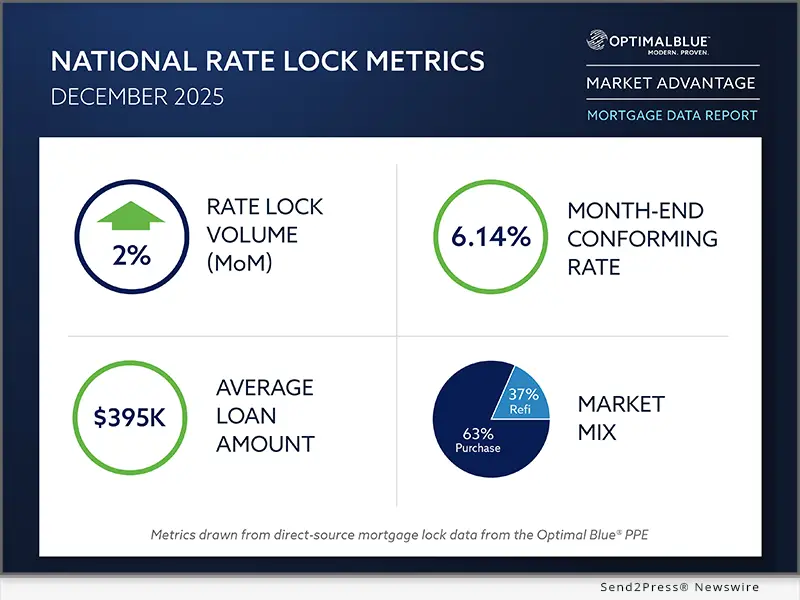
Image caption: Optimal Blue’s December 2025 Market Advantage mortgage data report.
Mortgage rates were largely stable in December. The Optimal Blue Mortgage Market Indices (OBMMI) 30-year conforming fixed rate, the benchmark for CME Group’s Mortgage Rate futures, finished the month flat at 6.14%. Meanwhile, the 10-year Treasury yield rose 14 basis points (bps) to 4.14%, reversing November’s spread widening and pushing the 10-year-to-OBMMI spread to 200 bps at year-end.
“Finishing the year with higher lock volume in December is a clear signal that borrower demand has adjusted to today’s rate environment,” said Mike Vough, senior vice president of corporate strategy at Optimal Blue. “Refinance activity continues to do the heavy lifting, but the fact that purchase volume held essentially flat month over month and finished the year higher than last December speaks to a market that is more durable than many expected.”
Lenders also made notable adjustments on the secondary side as pricing dynamics and execution strategies evolved. Best-efforts-to-mandatory spreads widened across products, bulk aggregator execution regained share, and mortgage servicing rights (MSR) values increased despite flat primary rates.
“December’s secondary data shows lenders actively recalibrating execution as spreads widened and pricing discipline remained tight,” Vough said. “The shift back toward bulk aggregation, combined with stable top-tier pricing and rising MSR values, reflects investor demand that is focused on end-of-year balance sheet management and long-term value as we head into 2026.”
Key findings from the Market Advantage report, derived from direct-source mortgage lock and secondary market data, include:
Volume trends and market composition
- Refinance share expands: Refinances accounted for 37% of all locks in December, up 224 bps MoM and 1,354 bps YoY. Rate-and-term refinance volume increased 13% MoM and more than 170% YoY, while cash-out refinances rose 1% MoM and 35% YoY. Overall refinance pull-through improved 194 bps from November to 69.2%.
- Purchase market remains resilient: Purchase locks slipped just 1% MoM despite typical holiday-driven seasonality and finished December 7% higher than a year earlier. Pull-through for purchase loans increased 199 bps MoM to 85.7%.
- Non-QM sets another record: Non-qualified mortgage production maintained its upward trajectory, finishing December above 9% of locks, up 50 bps MoM.
- Government and non-conforming gain share: Conforming loans accounted for 51% of locks in December, down 86 bps MoM and 18 bps YoY. Non-conforming share rose to 17%, up 17 bps MoM and 141 bps YoY. FHA, VA and USDA loans each gained share during the month.
- PUD share remains sizable: Planned unit developments (PUDs) accounted for 29% of locks by property type, up 123 bps MoM but below year-ago levels, when PUD share was higher.
Rates and pricing
- Rates largely unchanged: The OBMMI 30-year conforming fixed rate ended December flat at 6.14%. FHA rates declined 1 bp to 5.98%, VA rates fell 6 bps to 5.71% and jumbo rates dropped 3 bps to 6.41%.
- MSR values move higher: MSR values for conforming 30-year loans increased 5 bps to 1.14%, representing a 4.57 multiple, rising despite largely stable primary rates.
- Treasury yields rise as spreads widen: The 10-year Treasury yield increased 14 bps to 4.14% in December, compressing the mortgage–Treasury spread to 200 bps. Best-efforts-to-mandatory spreads widened across products, including a 2-bp increase for conforming 30-year loans and a 3-bp increase for government 30-year loans.
- Top-tier pricing holds: The share of loans sold at the highest price tier remained flat at 79%, while second-tier share was unchanged at 11%, reflecting continued pricing discipline across the market.
Channel and execution
- Execution mix shifts back toward aggregators: Lenders adjusted hedged execution strategies in December as bulk aggregators regained share at the expense of agency securitization and cash window channels.
- Bulk aggregator share rebounds: Hedged loan sales to bulk aggregators increased 200 bps MoM to 29%, reversing a multi-month decline.
- Securitization and cash window ease: Agency mortgage-backed securities (MBS) executions and cash window sales each declined 100 bps during the month.
- Investor participation increases: The number of active investors rose to 12 in December after holding steady at 11 for four consecutive months, modestly expanding execution options for lenders.
Product mix and borrower profiles
- Credit scores edge lower: The average borrower credit score declined to 732 in December from 733 in November, extending a gradual pullback from 746 in September.
- Loan sizes rise as leverage varies by market: The average loan amount increased to $394,502 from $391,323 in November. Loan sizes ranged from $812,240 in Los Angeles to $315,735 in San Antonio. Loan-to-value ratios ranged from 68.85% in the San Francisco–Oakland Bay Area to 87.69% in San Antonio, with a national average of 80.10%.
To view the full December 2025 Market Advantage report, complete the free subscription form: https://engage.optimalblue.com/market-advantage. Subscribers receive a report PDF each month with the latest data. Members of the press are eligible for special, advance access each month and should contact Olivia DeLancey to be added to the media list.
About the Market Advantage Report
Optimal Blue issues the Market Advantage mortgage report each month to provide insight into U.S. mortgage trends and drivers of lending profitability. Data is sourced from the Optimal Blue PPE, which is used to price and lock more than one-third of all mortgages nationwide, and Optimal Blue’s hedging and loan trading system, which supports approximately 40% of loans hedged and sold into the secondary market. As the leader in mortgage capital markets technology, Optimal Blue has a direct view of both origination and secondary market activity and the interconnectedness of the two. Unlike self-reported survey data, Optimal Blue’s direct-source data accurately reflect the in-process loans in lenders’ pipelines and secondary market executions. Visit Optimal Blue’s website to subscribe to receive the free report each month.
Nothing herein shall be construed as, nor is Optimal Blue providing, any legal, trading, hedging or financial advice.
About Optimal Blue
Optimal Blue powers profitability across the mortgage capital markets ecosystem. As the industry’s only end-to-end capital markets platform, our technology, data and integrations bridge the primary and secondary markets to help lenders of all sizes maximize performance – from pricing accuracy to margin protection and every step in between. Backed by over 20 years of proven expertise, our modern, cloud-native technology delivers the real-time automation, actionable data and seamless connectivity lenders need to navigate market volatility and scale for growth. To learn more about how Optimal Blue delivers measurable ROI, visit OptimalBlue.com.
MULTIMEDIA:
Image link for media: https://www.Send2Press.com/300dpi/26-0113-s2p-opbluedec25-300dpi.webp
Image caption: Optimal Blue’s December 2025 Market Advantage mortgage data report
###
MEDIA ONLY CONTACT:
(not for print or online)
Leslie W. Colley
Depth for Optimal Blue
leslie@depthpr.com
678-622-6229
News Source: Optimal Blue

